Update - the old top post was wiped out in favor of new, better data and a better map. If you saw/used the map that was originally here, that map is what's called "Linear" below.
This post is all about the Throttle map in UpRev. You'll need the Tuner license (or take this data to a tuner) to use this. Keep in mind this is all from an NA vehicle with a fairly maximal set of bolt-ons and a dyno tune. YMMV on a bone stock car, and I especially wouldn't blindly follow this on FI.
After a bunch of testing (and posting, and thinking, and testing more, etc) I've finally settled on a throttle map I really like. I've done some drivability testing on this map, and more importantly I've done datalogging of several reasonable candidate maps with Cipher to add some numeric credibility to my subjective opinions.
Background:
The stock throttle map uses lower values at the upper end of the pedal range when at lower RPMs. This doesn't let you get on full power in the lower part of the range, instead opening up a bit gradually as the RPMs rise. This is sometimes perceived as throttle "lag" at low RPM. UpRev tuners have figured out that you can "fix" this by putting a solid line of slightly-over-maximum values (3800) in the uppermost column of the data, and then trying to smooth that into the existing factory data a bit for drivability. The idea is to give you a similar-looking throttle curve in the useful parts at all RPMs, which reaches the maximum.
However, "simple" or "naive" attempts to just set a few top columns fixed at 3800 and step off of that in linear amounts (which is what my tuner did. I don't fault him for that, it took hours of mathing around with curve fitting algorithms, plotting software, and testing to do better), you get a jerky throttle response map, and you can feel it places when driving.
My first attempt to smooth this out (while retaining the benefits) was a linear map from low-end stock values out to a couple columns of 3800, which was better, but still not ideal. I found that a simple 2nd order polynomial curve going through 3 target data points (stock 0% values, a fixed value at 50%, and 3800 at 100%) seemed to give better results, given some tuning on the middle fixed value. A reasonably magic value for the 50% mark seems to be 2300. The polynomials were derived using the perl module
Algorithm::CurveFit from CPAN.
The Data:
In all of the charts below, the maps in use are:
Linear: This was my first smoothing attempt, the one that was posted here at the top originally. It's a straight shot from around 18.8% up to a couple columns of 3800's at the end.
Curve 2700: This is the good polynomial curve, but with the middle value set to 2700, as an example of what happens when it's a bit out of range.
Curve 2300: This is the good curve, with the middle value at 2300. You'll notice it tends to approximate the stock curves in Cipher data graphs, which is a really good sign.
Stock: This is the bone stock throttle map
Tuner: This is the simplistic "jam some 3800s into the top of the chart and roughly smooth down from there" approach that came from my tuner. I didn't datalog this for the data charts since I threw it out of the running long ago, but it's in the first chart just for comparison sake.
These charts were generated from the raw data using
Plot.
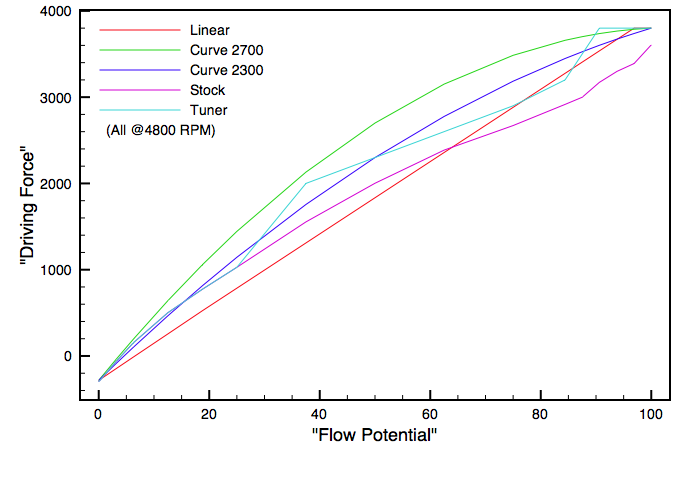
This first graph is of the raw table data itself, just the line of values for the 4800 RPM row, to give you an idea of the shape and smoothness of each of the candidate maps. Note that axis labels are what they're called in the UpRev Rom Editor, but even UpRev acknowledges that we don't really know what these numbers really mean. "Flow Potential" seems to roughly correspond with the accelerator pedal position, and "Driving Force" has something to do with engine throttling via the butterflies and/or VVEL.
Note that "Curve 2300" makes a good smooth curve approximation of the Tuner values, and the "Curve 2700" is the same shape but roughly bumped up to enclose the Tuner values.
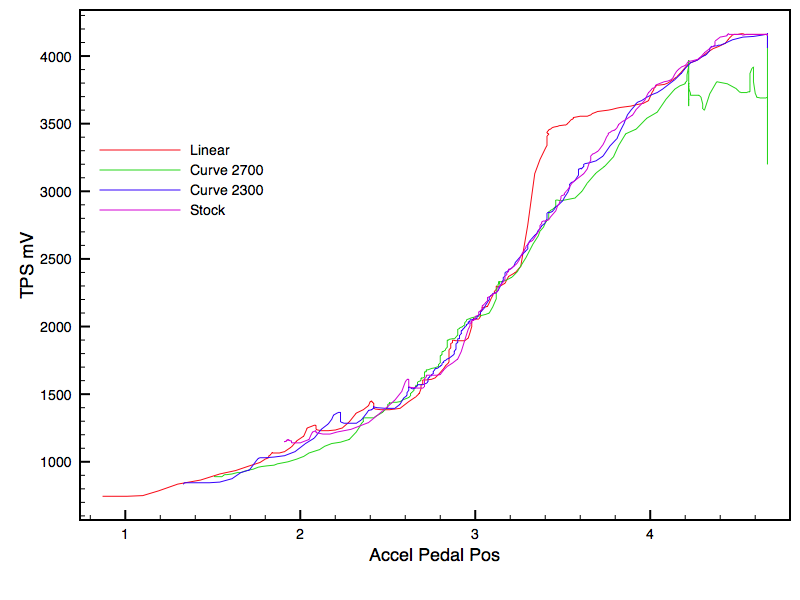
The next two charts are based on Cipher data logging of the first 4 candidate maps above. The log snapshot was taken with me rolling through the accelerator pedal from a low position to full throttle at a reasonable approximation of "linearly" in 3rd gear from around 3000 RPM to redline. Since I knew I wouldn't be able to reliably reproduce the same pedal curve for each run, the time-axis was thrown out and the data has been re-mapped strictly versus the accelerator position itself, to provide clean comparisons.
The first datalogging chart is Accel Pedal vs Throttle Position Sensor. The important takeaways here are that (1) the Linear map actually has a big non-linear bump in the real world versus the stock curve, (2) the 2700 curve does crazy things up top and doesn't even sustain full throttle, and (3) the 2300 curve does a good job approximating the stock response curve.
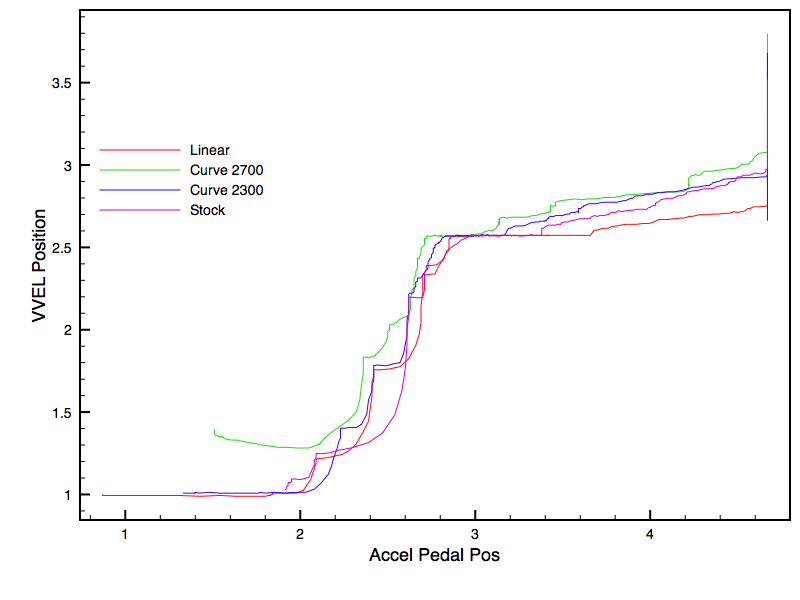
The other is Accel Pedal vs "VVEL Position Sensor". Don't ask me what that means, but it's still interesting to observe diffs in the shapes. Note again the 2300 curve is the closest to stock, the 2700 curve is kinda screwy at the bottom, and the linear curve is a bit off at the top in the opposite direction. I take the stronger divergences away from the stock shape to mean the engine is telling me "you're doing it wrong"

So I've settled on the 2300 Curve above. It seems to provide the best blend of (a) getting those 3800 values across all RPMs at the top of the pedal, so you're not limited by "throttle lag" at lower RPMs, (b) having a smooth graph shape with no sharp, unpredictable transitions, and (c) having smooth results that closely mirror stock in the important related Cipher datalogs during a smooth pull through 3rd gear.
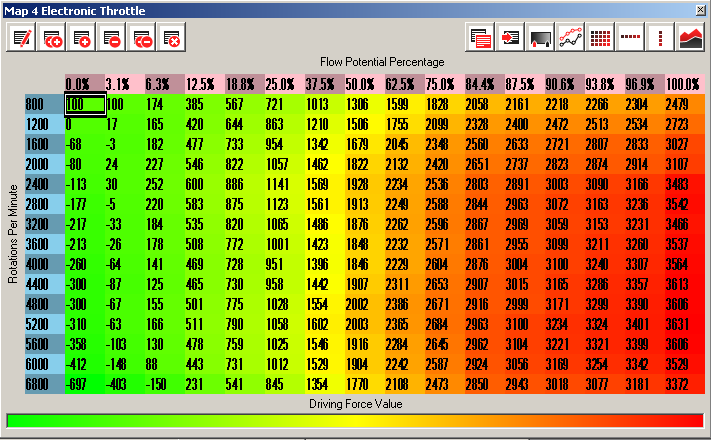
The 2300 Curve Data:
You can copy this straight from here and paste it into a throttle table in UpRev:
Code:
8064 8101 81A0 82CC 83F1 8507 8718 88FC 8AB5 8C41 8D4F 8DA3 8DF3 8E44 8E8F 8ED8
803E 80DE 8181 82B3 83DE 84F9 8712 88FC 8AB8 8C46 8D53 8DA6 8DF6 8E46 8E90 8ED8
8018 80BC 8162 829A 83CB 84EB 870C 88FC 8ABC 8C4B 8D57 8DAA 8DF9 8E48 8E92 8ED8
7FF2 8099 8142 8281 83B8 84DD 8706 88FC 8ABF 8C50 8D5B 8DAD 8DFC 8E4A 8E93 8ED8
7FCB 8076 8122 8267 83A4 84CE 8700 88FC 8AC3 8C55 8D60 8DB1 8DFF 8E4C 8E94 8ED8
7FA5 8053 8103 824E 8391 84C0 86FA 88FC 8AC7 8C59 8D64 8DB5 8E02 8E4E 8E95 8ED8
7F7F 8031 80E4 8235 837D 84B2 86F4 88FC 8ACA 8C5E 8D68 8DB8 8E05 8E50 8E96 8ED8
7F59 800E 80C5 821C 836A 84A3 86EE 88FC 8ACE 8C63 8D6C 8DBC 8E08 8E53 8E97 8ED8
7F33 7FEC 80A6 8203 8357 8495 86E8 88FC 8AD1 8C68 8D70 8DBF 8E0B 8E55 8E98 8ED8
7F0D 7FC9 8087 81EB 8344 8487 86E2 88FC 8AD5 8C6C 8D74 8DC3 8E0E 8E57 8E99 8ED8
7EE6 7FA6 8067 81D1 8330 8478 86DC 88FC 8AD8 8C71 8D78 8DC6 8E11 8E59 8E9A 8ED8
7EC0 7F83 8048 81B8 831D 846A 86D6 88FC 8ADC 8C76 8D7C 8DCA 8E13 8E5B 8E9C 8ED8
7E9A 7F60 8029 819F 8309 845C 86D0 88FC 8AE0 8C7B 8D80 8DCE 8E16 8E5D 8E9D 8ED8
7E64 7F2F 7FFC 817C 82EE 8448 86C8 88FC 8AE5 8C82 8D86 8DD3 8E1B 8E60 8E9E 8ED8
7D47 7E2C 7F13 80C1 825D 83DD 869B 88FC 8AFF 8CA5 8DA5 8DED 8E30 8E6F 8EA7 8ED8
The results should look like this in the editor when displaying decimal values:
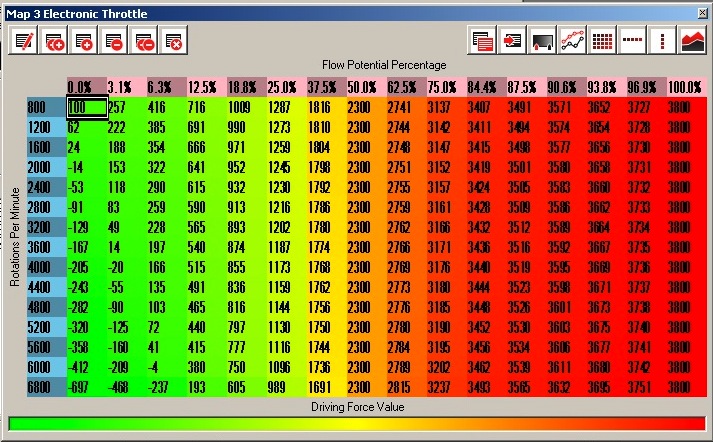
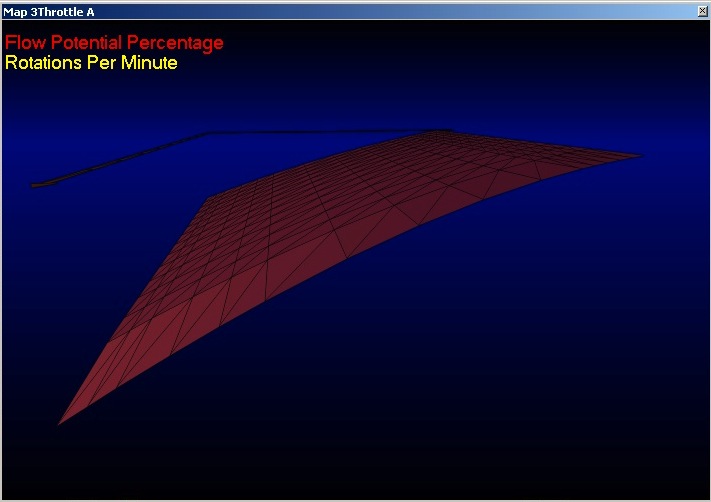
And this is the UpRev view of the whole map surface for it:
If you're concerned about compatibility between my stock ECU setup in general and yours, this is what my stock throttle map looks like for comparison: